
Picture this. It is a regular Tuesday, and a stock you have been watching has fallen for five days straight. You open your charting app, glance at the RSI, and it reads 28. "Oversold," you whisper, and you buy. The stock falls another 12% over the next week. What went wrong? Nothing about the indicator — and everything about how it was used.
The Relative Strength Index, or RSI, is one of the most popular technical indicators in the world, and almost certainly the first one most Indian traders ever learn. It sits on the chart of every Nifty stock on Zerodha Kite, Groww, Upstox and Angel One. It is beloved because it is simple. And that simplicity is exactly why so many people lose money with it.
This guide fixes that. By the end, you will understand what RSI truly measures, how to read it like a professional rather than a beginner, and — most importantly — how to combine it with other tools so that it helps you maximize profits and minimize losses instead of luring you into bad trades.
What the RSI Indicator Really Is (and Why Its Name Misleads You)
The RSI was created by J. Welles Wilder Jr., a mechanical engineer turned commodities trader, and introduced in his 1978 classic New Concepts in Technical Trading Systems — the same book that gave us the ATR, Parabolic SAR and ADX. Decades later, it remains a cornerstone of technical analysis.
Here is the first thing almost everyone gets wrong. Despite the name, the "Relative Strength Index" does not compare one stock against another. It measures a security's momentum relative to its own recent price history. A more honest name would be the "Internal Strength Index." RSI is a momentum oscillator: it captures the speed and size of recent price moves and squeezes that information onto a tidy scale from 0 to 100.
The formula — without the headache
You will never have to calculate RSI by hand (your platform does it instantly), but understanding the engine helps you trust the dashboard. The core formula is:
The RSI formula
RSI = 100 − [ 100 / (1 + RS) ], where RS = Average Gain ÷ Average Loss over the chosen look-back period (14 by default).
In plain words: over the last 14 candles, the indicator compares how much price has gained on up-days against how much it has lost on down-days. If up-moves dominate, RS is large and RSI pushes toward 100. If down-moves dominate, RSI sinks toward 0. Wilder used a smoothing method (similar to an exponential moving average) so that each new value blends in the latest data without wild jumps. That is why the 14-period RSI feels responsive but not jumpy.
Two edge cases make the scale intuitive: if every candle in the look-back is an up-candle, there are no losses, RS becomes infinite, and RSI reads 100. If every candle falls, RSI reads 0. In the real world you almost never see those extremes — which is precisely why a reading near 70 or 30 feels meaningful.
RSI does not tell you whether a stock is cheap or expensive. It tells you how fast and how forcefully buyers or sellers have been winning the recent tug-of-war.— The core idea behind Wilder's oscillator
Reading RSI: Overbought, Oversold and the All-Important 50 Line
Wilder's original guidance was straightforward: an RSI above 70 signals an overbought condition where a pullback may be near, and a reading below 30 signals oversold conditions where a bounce may be due. The 50 level is the dividing line — above 50, average gains beat average losses (a bullish lean); below 50, the bears are in control.
RSI Level | What it suggests | How to treat it |
|---|---|---|
Above 70 | Overbought — strong upward momentum | Watch for exhaustion in ranges; sign of strength in trends |
50–70 | Healthy bullish momentum | Favour long setups with the trend |
The 50 line | Momentum balance point | Cross above = bullish bias; below = bearish bias |
30–50 | Bearish momentum | Favour short setups with the trend |
Below 30 | Oversold — strong downward momentum | Watch for bounces in ranges; sign of weakness in trends |
The professional secret: RSI lives in ranges, not at 70/30
Here is where amateurs and professionals part ways. The analyst Constance Brown, building on the work of Andrew Cardwell, showed that RSI does not bounce neatly between 0 and 100. Instead it lives inside different bands depending on the bigger trend:
In a bull market, RSI tends to oscillate roughly between 40 and 80, with the 40–50 zone acting as support on pullbacks.
In a bear market, RSI tends to oscillate between 20 and 60, with the 50–60 zone acting as resistance on rallies.
This single insight rewrites the rulebook. In a strong uptrend, an RSI reading of 70 is not a reason to sell — it is proof of strength. Selling every time RSI taps 70 in a roaring bull market is one of the fastest ways to leave money on the table. Cardwell took this further with "positive and negative reversals," the mirror image of divergence, which confirm that a trend is likely to continue rather than reverse.
Quick win
Before you read RSI, ask one question: is this stock trending or ranging? In a range, RSI extremes mean reversal. In a trend, the same extremes mean continuation. Same indicator, opposite message.
How to Use RSI to Maximize Profits: 4 Strategies That Work
1. Overbought / oversold reversals (best in ranging markets)
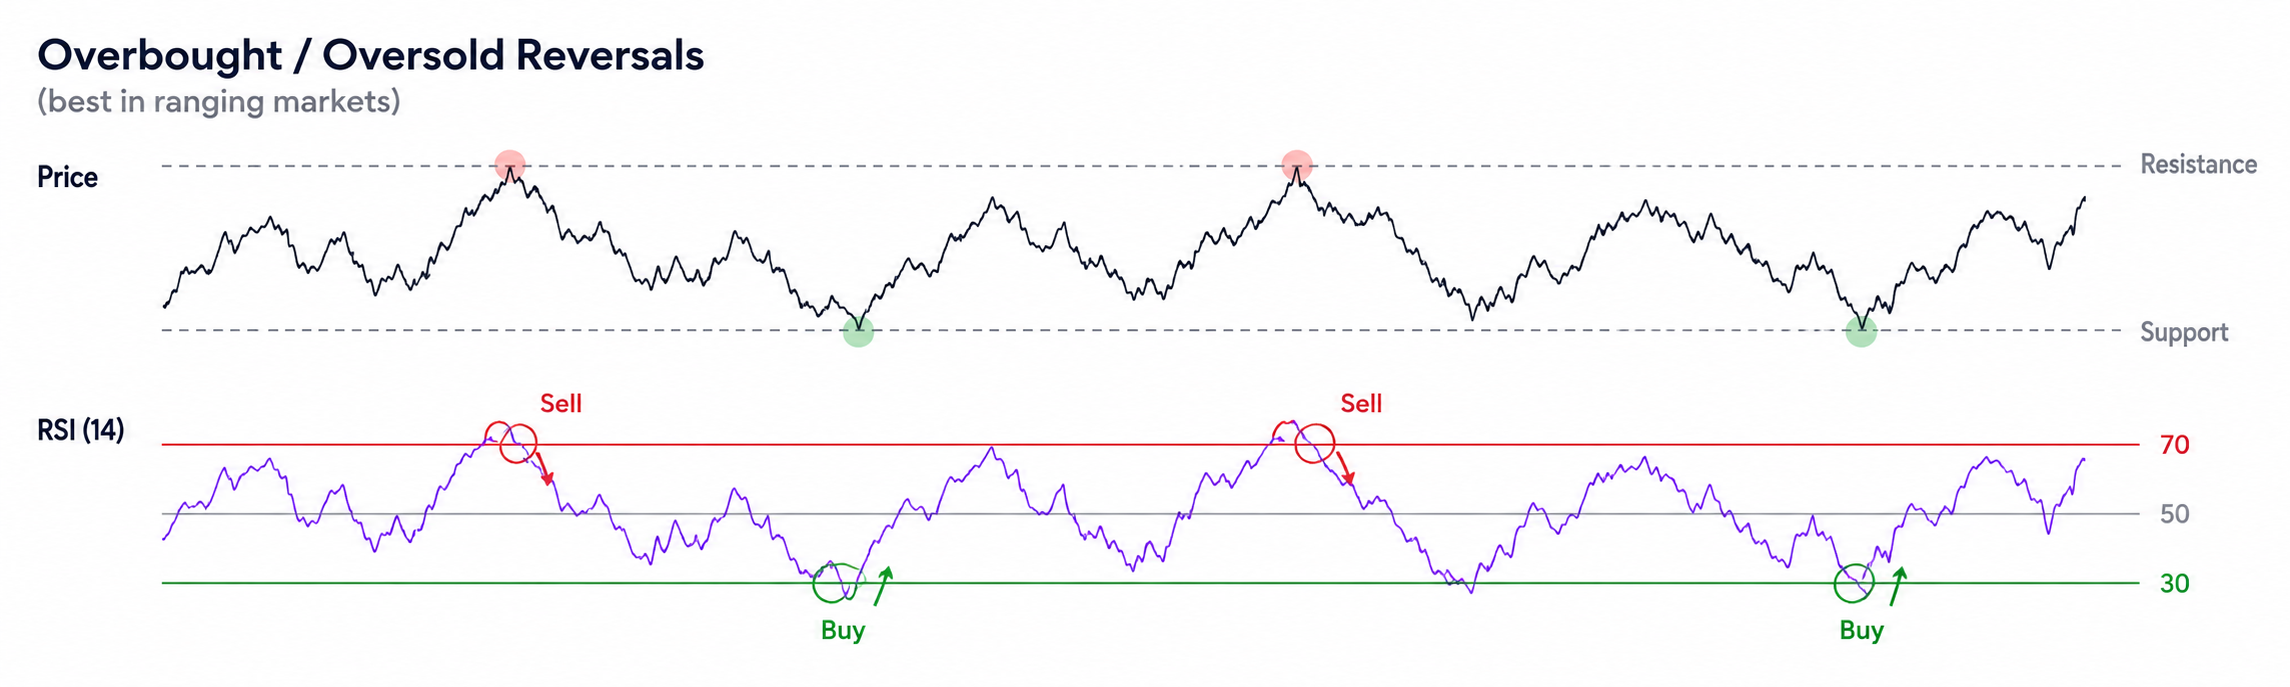
The classic move: in a sideways, range-bound stock, look to buy as RSI climbs back above 30 and to sell as it falls back below 70. The crucial discipline is to wait for the cross back, not to buy the instant RSI touches 30. That small patience filters out a huge number of "falling knife" entries like the one in our opening story.
2. RSI divergence — the highest-value signal
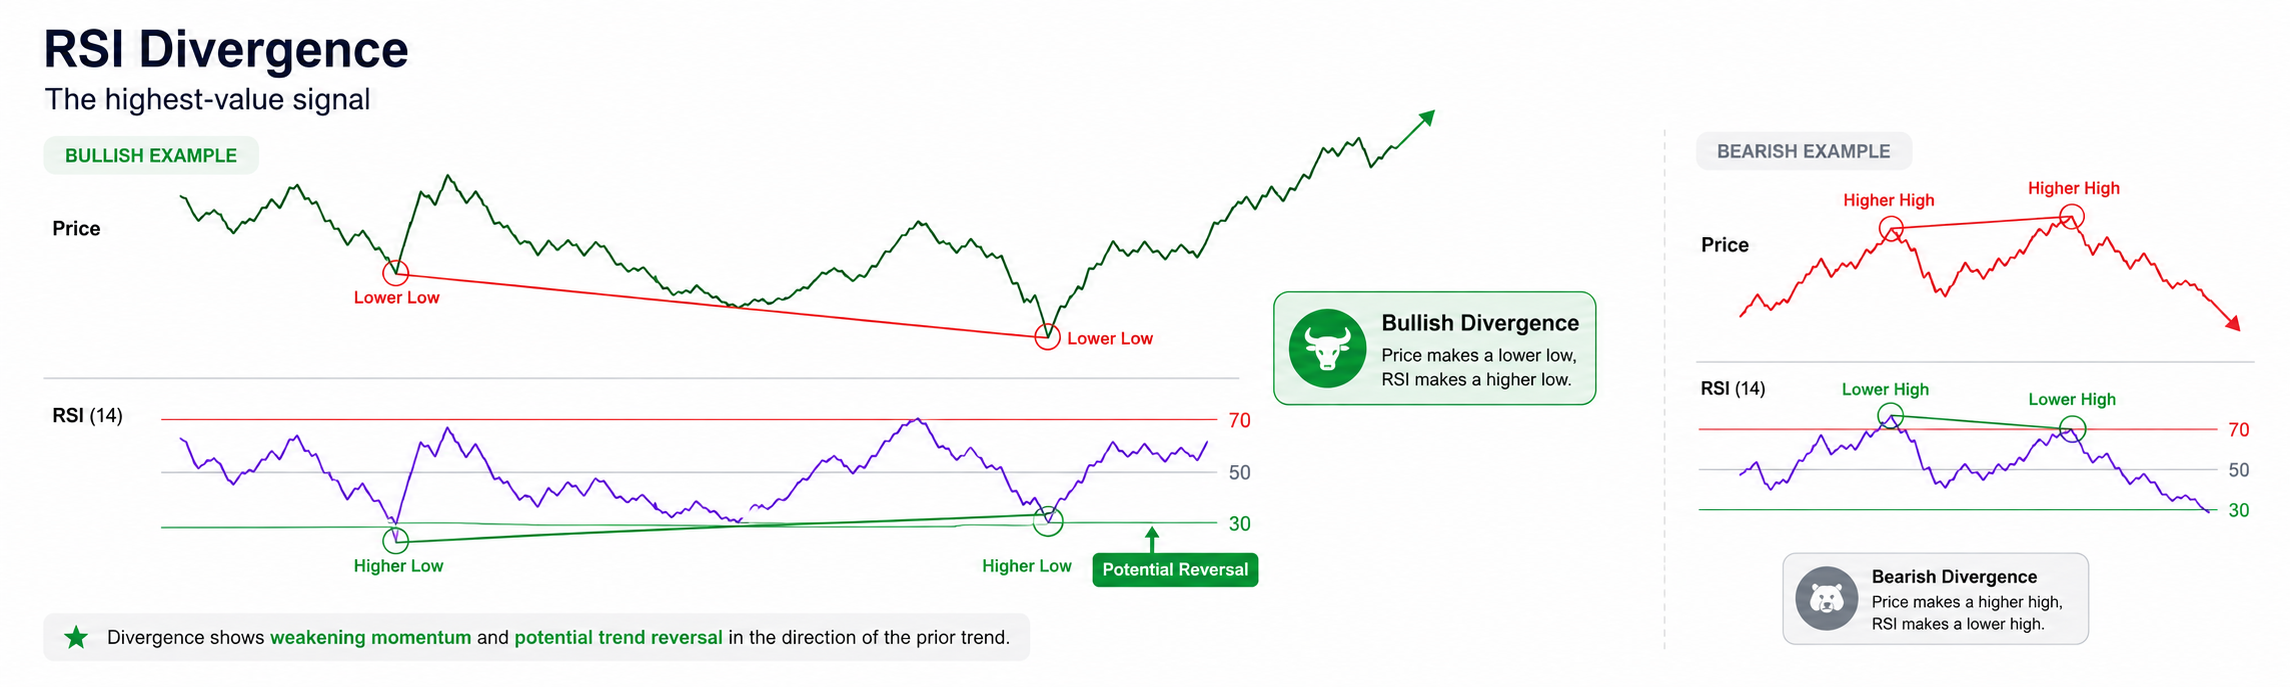
Divergence is where RSI earns its reputation. It occurs when price and RSI disagree:
Regular bullish divergence: price makes a lower low, but RSI makes a higher low. Selling pressure is fading — a reversal up may be near. Strongest near oversold.
Regular bearish divergence: price makes a higher high, but RSI makes a lower high. Buying pressure is weakening — a reversal down may be near. Strongest near overbought.
Hidden bullish divergence: price makes a higher low while RSI makes a lower low — a continuation signal in an uptrend, ideal for buying pullbacks.
Hidden bearish divergence: price makes a lower high while RSI makes a higher high — a continuation signal in a downtrend.
Remember the rule: regular divergence warns of reversal; hidden divergence signals continuation. But never trade divergence alone — it can persist far longer than feels reasonable. Confirm it at a support or resistance level, with a reversal candle, or with a volume spike.
3. Failure swings (Wilder's original method)
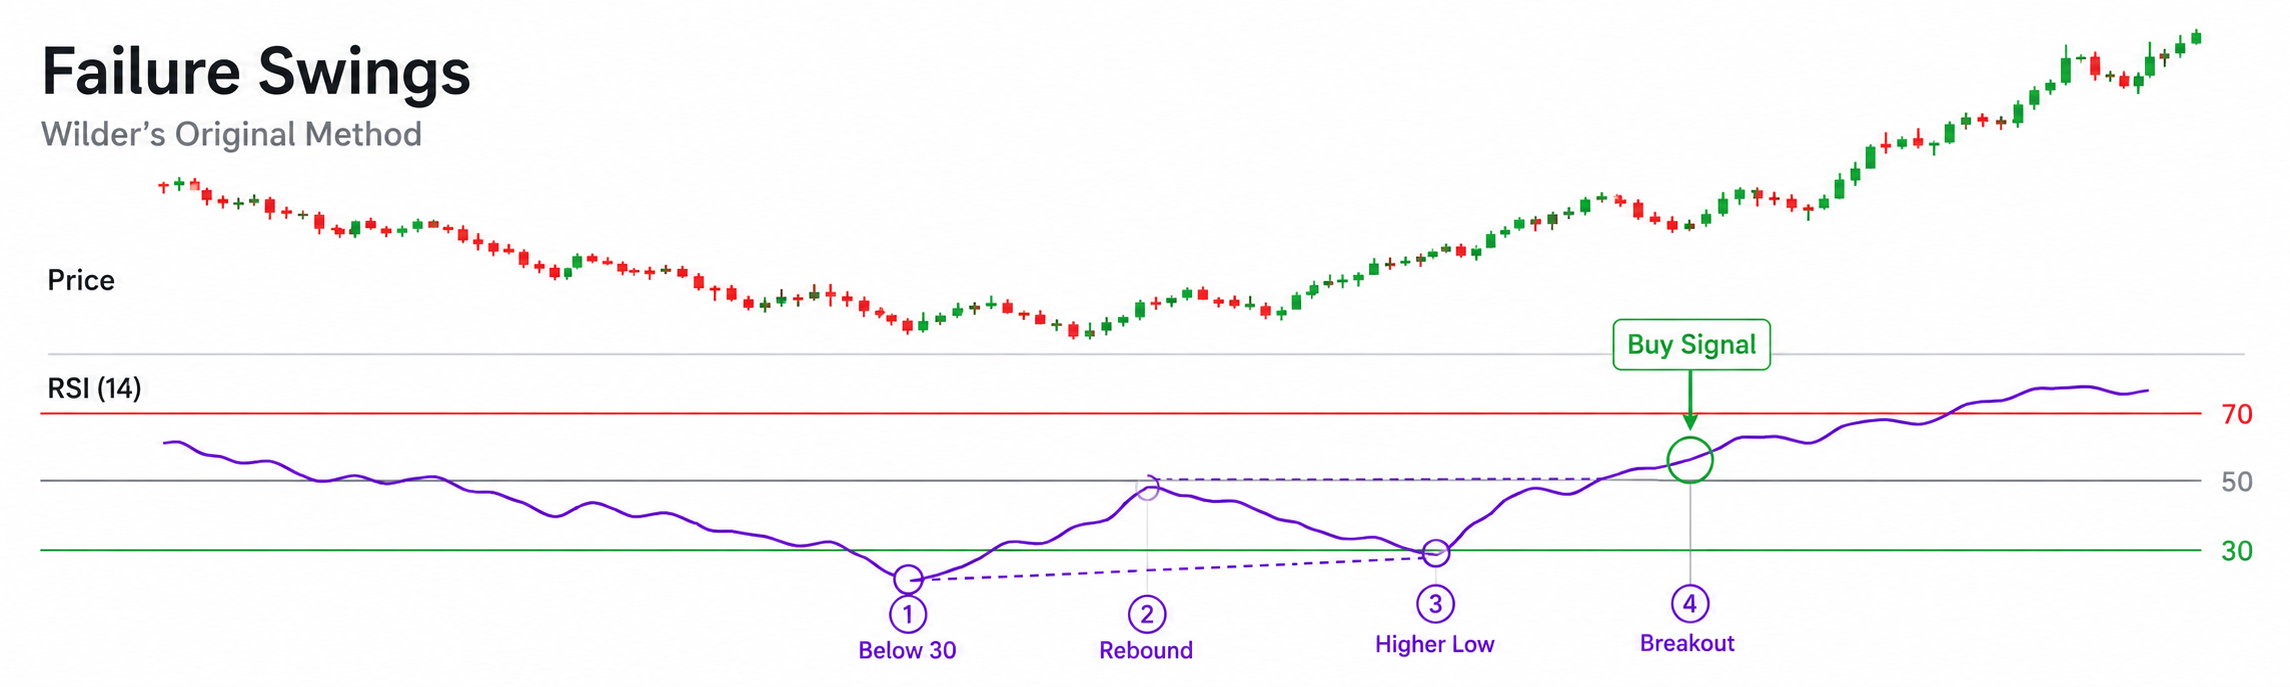
Failure swings happen on the RSI itself, independent of price, and Wilder called them strong reversal indications. A bullish failure swing forms when RSI drops below 30, bounces, dips again but holds above 30 (a higher low), then breaks above its prior swing high. A bearish failure swing is the inverse near 70. Because the pattern lives entirely inside the indicator, it sidesteps a lot of price-chart noise.
4. RSI trendline breaks and the 50-line cross
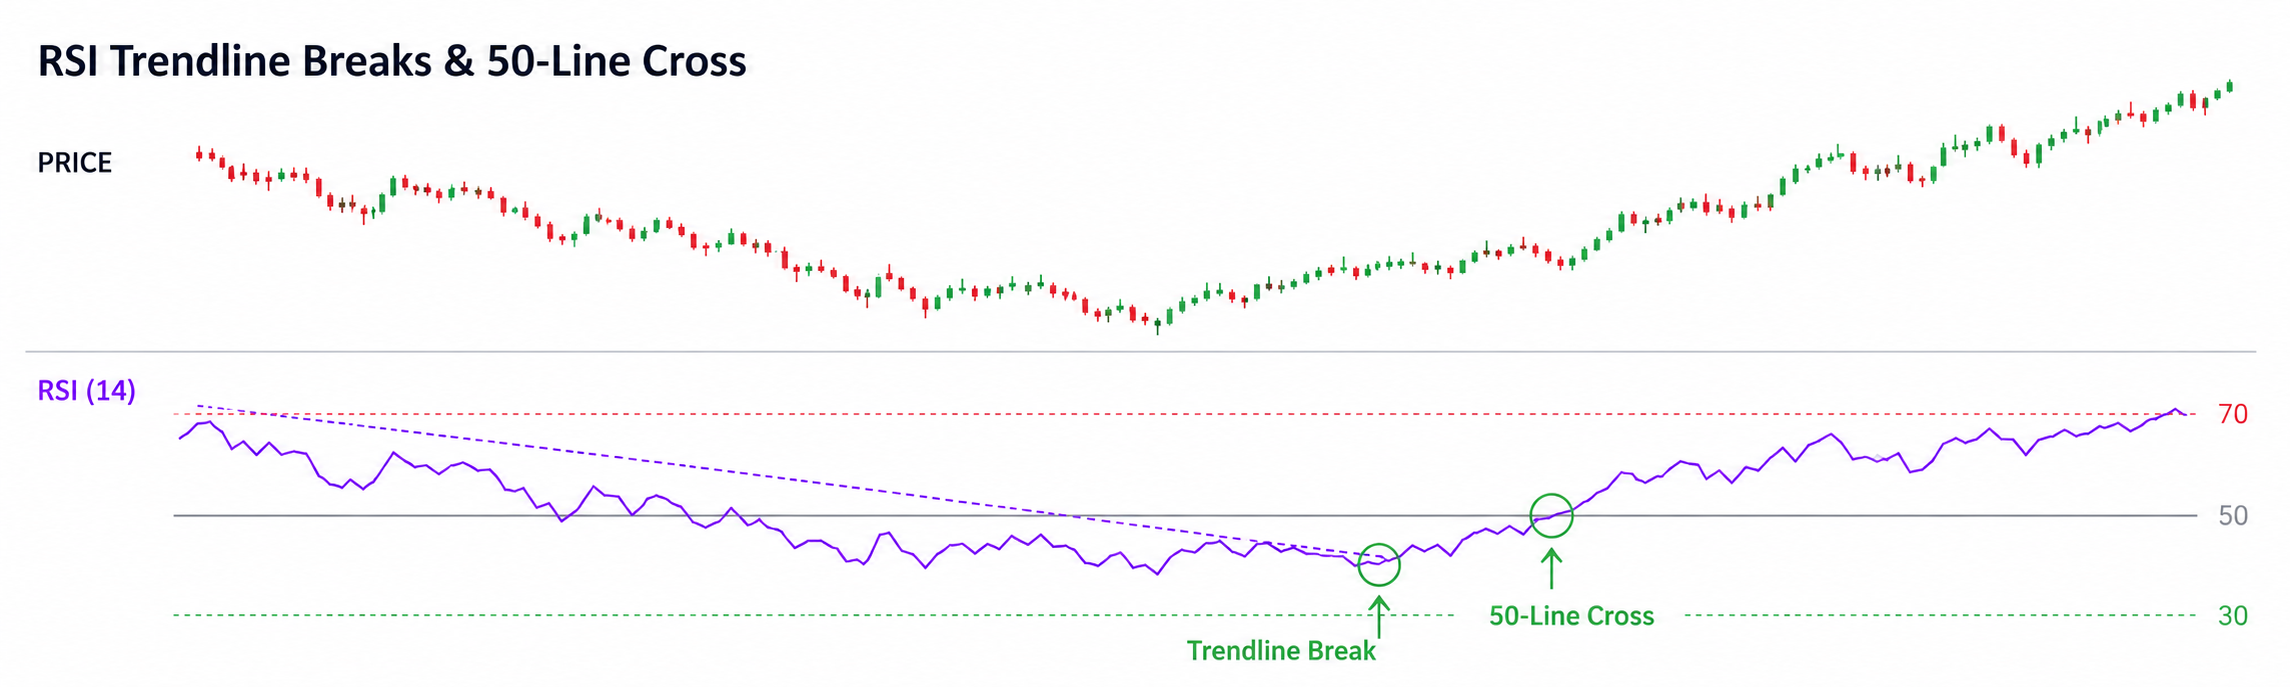
RSI forms its own peaks and troughs, so you can draw trendlines directly on it. A break of an RSI trendline often precedes a move in price. Many trend traders also use the simplest filter of all: a cross above 50 confirms a bullish bias, a cross below confirms a bearish one — especially powerful when it lines up with price crossing a key moving average.
RSI Settings That Match Your Trading Style
There is no universally "best" RSI setting — only the one that fits your timeframe. Shorter periods react faster and lead tops and bottoms but throw more false signals; longer periods are smoother and more reliable.
Trading style | Chart | RSI period | Levels |
|---|---|---|---|
Scalping | 1–5 min | 5–7 | 80 / 20 |
Intraday | 5–15 min | 7–9 | 70/30 or 80/20 |
Swing trading | Daily / 4H | 14 (classic) | 70 / 30 |
Positional / long term | Weekly | 14–21 | 60 / 40 |
A useful note for Indian traders: Zerodha Kite's RSI study actually defaults its overbought/oversold lines to 80 and 20 rather than 70/30, nudging you toward stronger, less frequent signals. Whatever you choose, resist the urge to keep tweaking the number until your past trades look perfect — that is curve-fitting, and it rarely survives live markets.
RSI Indicator Combinations That Actually Work
RSI alone is a single voice. The magic — and the answer to the "combinations" question every serious trader asks — is pairing it with tools that measure different things: trend, volatility and volume. Stacking RSI on top of another momentum oscillator that measures the same thing adds clutter, not clarity.
RSI + Moving Averages — the workhorse
This is the single most valuable combination. Use a long moving average (the 50/200 or the 200-day) to define the trend, then take RSI signals only in that direction. Look for oversold RSI buys when price is above the 200-DMA; look for overbought RSI sells when price is below it. This one filter eliminates most counter-trend mistakes.
RSI + MACD — momentum confirmation
MACD is a trend-following momentum tool; RSI is a leading oscillator. Use MACD to confirm direction and RSI to time the entry. A high-conviction long looks like this: a bullish MACD crossover, RSI bouncing from oversold, and RSI pushing back above 50. When divergence shows up on both RSI and MACD at once, pay close attention.
RSI + Bollinger Bands — volatility context
When price tags the lower Bollinger Band and RSI is oversold and turning up, you have a far stronger reversal case than either alone. A Bollinger "squeeze" warns a breakout is coming; pair it with an RSI failure swing to pick the likely direction.
RSI + Support / Resistance & Volume
RSI oversold at a tested support level is a serious signal; oversold in mid-air is not. And volume validates everything — a strong bounce off oversold RSI on heavy volume signals real buying, while an overbought RSI on fading volume warns the rally is running on fumes.
Combination | RSI's job | The other tool's job |
|---|---|---|
RSI + 200-DMA | Time the entry | Define the trend direction |
RSI + MACD | Pinpoint timing | Confirm momentum & direction |
RSI + Bollinger | Confirm exhaustion | Flag volatility extremes |
RSI + Volume | Show momentum | Prove conviction behind the move |
The sweet spot is three to four complementary tools. More than that and you drift into "analysis paralysis," where indicators contradict each other and you freeze.
How to Use RSI to Minimize Losses
Maximizing profit and minimizing loss are two sides of the same coin, and the loss side is where most traders are destroyed. RSI helps only if it is wrapped in real risk management.
Always trade with a stop-loss. On an RSI divergence or failure-swing long, place the stop just below the recent swing low; on a short, just above the swing high. Decide your exit before you enter.
Size every position so one loss can't hurt you. Never stake your account on a single RSI signal, no matter how perfect it looks.
Do not fight strong trends. Overbought can stay overbought for weeks. Use range rules (40–80 in bulls, 20–60 in bears) instead of blindly shorting at 70.
Never trade RSI alone. Confirm with trend, structure and at least one other tool.
A reality check for Indian traders
Per SEBI's July 2025 study, 91% of individual traders lost money in equity derivatives in FY25, with aggregate net losses of around ₹1.05 lakh crore. A separate SEBI study found 7 out of 10 intraday cash-market traders lost money in FY23. The single biggest difference between survivors and the rest is not a better indicator — it is disciplined risk management.
6 Costly RSI Mistakes (and How to Avoid Them)
Treating 70/30 as automatic sell/buy buttons. They are conditions, not commands. Wait for confirmation.
Ignoring the bigger trend. Always know whether you are in a range or a trend before reading RSI.
Counter-trend trading in strong moves. Shorting a powerful uptrend just because RSI is "high" is how accounts bleed.
Over-optimising the settings. The "perfect" backtested period usually fails live. Keep it robust, not perfect.
Acting on divergence with no confirmation. Divergence can persist; pair it with structure and a stop.
Using RSI in isolation. One indicator is one opinion. Demand a second.
RSI in the Indian Market: Tools, Stocks and a Reality Check
RSI is everywhere in Indian retail trading. It is built into Zerodha Kite, Upstox, Groww, Angel One and TradingView, and can be applied to any timeframe on the Nifty 50, Sensex, Bank Nifty and individual names like Reliance, TCS, HDFC Bank and Infosys. Screeners on platforms such as Trendlyne publish daily lists of overbought and oversold stocks across the Nifty 500.
The retail wave is real. The NSE crossed 12 crore unique registered investors in September 2025 and kept climbing into 2026, with a strikingly young, diverse base — roughly one in four investors are women, and about 40% are under the age of 30.
12 cr+
Unique registered investors on NSE (2025)
91%
Individual F&O traders who lost money in FY25 (SEBI)
₹1.05L cr
Net derivatives losses by individuals, FY25 (SEBI)
The lesson from those numbers is not "don't trade." It is "respect the difficulty." Indian educators like Elearnmarkets and StockEdge specifically teach Cardwell-style range rules using local stocks — Reliance holding a 40–80 bull range, for example — precisely because reading RSI through the lens of the trend, rather than naïve 70/30 signals, is what separates the profitable minority from the losing majority.
Best Practices & Expert Insights
Professionals treat RSI as a momentum-and-trend tool, not a reversal button. A few principles separate disciplined traders from the crowd:
Read RSI in context. Range rules and divergence beat fixed 70/30 thresholds.
Backtest before you trust. Evidence on RSI is mixed and setting-dependent. Test your exact rules on the specific stock and timeframe you trade, and judge by expectancy and drawdown — not win rate alone.
Ignore the "91% win-rate" marketing. A high win rate means nothing if a handful of big losses wipe out many small wins. Profitability, not the strike rate, pays your bills.
Marry RSI to price action and fundamentals. Use the indicator to time entries within a thesis you already believe in.
The indicator is never the edge. The edge is the discipline you wrap around it.— A principle every consistent trader eventually learns
Frequently Asked Questions
Final Thoughts: RSI Is a Compass, Not an Autopilot
The RSI indicator is genuinely important — it gives you a fast, honest read on momentum that few other tools match. But importance is not the same as magic. Used naïvely as a 70/30 buy-sell switch, it will hand you losses. Used the way professionals do — read in the context of the trend, confirmed by divergence and range rules, combined with moving averages, volume and support, and always wrapped in a stop-loss — it becomes a sharp edge that helps you press your winners and cut your losers early.
Start simple. Pick one combination — the 200-DMA for trend plus RSI 14 for timing — and master it on a single stock before adding anything else. The traders who survive are rarely the ones with the most indicators. They are the ones with the most discipline.
Disclaimer
This article is for educational purposes only and is not investment advice. Trading and investing carry risk of loss; SEBI data shows the large majority of retail derivative and intraday traders lose money. Do your own research and consider consulting a SEBI-registered advisor before acting.

0 comments